I'll never forget the first time I saw the TI-89 Titanium graphing calculator. It was at summer camp, I think, and a crowd had gathered around some lucky α-nerd who was demonstrating this new gadget that could do derivatives and integrals and trig analytically, and spit out functions as answers, or expressions with roots and e and π. It was the embodiment of its CISC Motorola 68000 brain, at its zenith. Needless to say, my TI-86 couldn't do that. My heart fluttered and my stomach dropped- it was love at first sight. So when I got home I immediately started making all sorts of (not very) subtle inquiries, only to learn that this Nimbus 2001 currently retailed for A Hundred and Fifty Dollars! And I already had a Nimbus 2000. So I took a job cleaning tables at a local cafe, and a couple days of (sweat+tears+blood+elbow grease) later, I had my very own TI-89 Ti! The world was my oyster. I still remember the first thing I ever typed in:
ii
	e-π/2
	.20788
But once you have Matplotlib embedded in PyQt, with a trivial investment of effort you can make any graphing calculator ever manufactured obsolete, without paying a dime... as long as you have a computer. And you can use the mpl/PyQt combo to make your graphing calculator almost arbitrarily powerful (it will hold up to pretty much any end-use except rapid display-rates or 3D rendering, in both of which cases everything is going to start naturally migrating C-wards).
And one thing that it is important to appreciate when writing a graphing calculator app, is that there are as many ways of going about it as there are mathematical snowflakes in Russia... a whole lot. So I am not going to show you how to make an especially ornate or robust graphing calculator; rather, I merely want to provide a skeleton key which you can adopt as a template/inspiration for whatever creative functionality or design suits your imagination, needs, and whims.
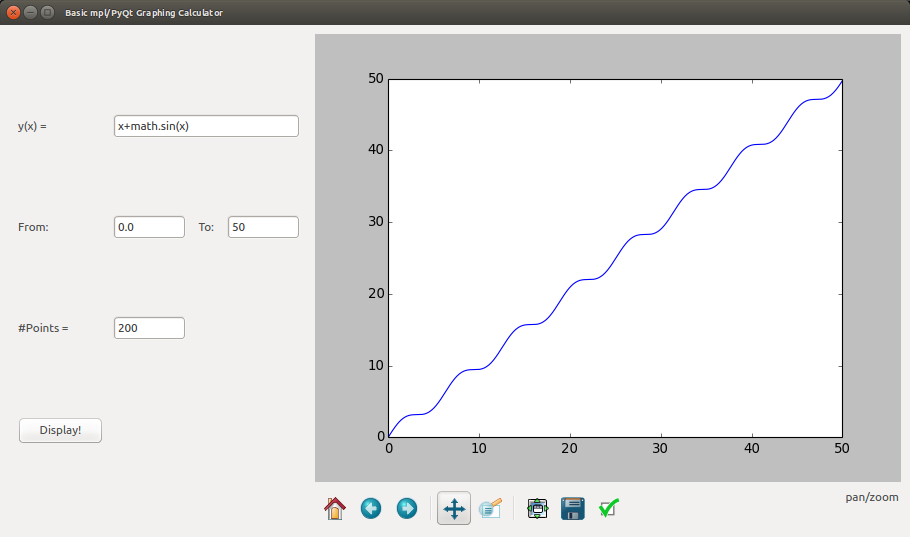
Thus, the simplest relevant example will be a single, 2D line plot with the vertical axis as the dependent variable and the horizontal axis independent. Once you have this one down, it will be trivial to expand to radial, parametric, multivariable, or even general analytic-form equations. You could solve systems of the above, or enable multiple selectable/deletable inputs, extend the interface to integro-differential equations, or evaluate and solve regressions from uploadable static or streamed datasets... anything
But before we learn to drive a spaceship, first we have to learn how to float.
The first thing that our app will need is some means of typing in the function that we want to display. And because we read (computer code) from left to right, it would make sense to put our input section on the left, and our output section on the right of the application. So let's add a second layout for our left-side input widgets, and then initialize a container box to store both halves. We will use a QGridLayout stored in an abstract container QWidget for the inputs, for reasons that will become clear momentarily. In this case, our layout section would look like this:
        leftBox = QtGui.QGridLayout()
        self.dumbWidget = QtGui.QWidget()
        self.dumbWidget.setFixedWidth(300)
        self.dumbWidget.setLayout(leftBox)

        rightBox = QtGui.QVBoxLayout()
        rightBox.addWidget(self.canvas)  # the matplotlib canvas
        rightBox.addWidget(self.ntb)

        leftRight = QtGui.QHBoxLayout()
        leftRight.addLayout(self.dumbWidget)
        leftRight.addLayout(rightBox)
        self.main_frame.setLayout(leftRight)
        self.setCentralWidget(self.main_frame)
	self.funcLabel = QtGui.QLabel("Y(x) = ")
	self.funcEntry = QtGui.QLineEdit("Type your function here")
	self.funcEntry.setCursorPosition(0)

	self.goButton = QtGui.QPushButton("Display!")
	self.rangeLoLabel = QtGui.QLabel("From: ")
	self.rangeLoEntry = QtGui.QLineEdit("0.0")
	self.rangeLoEntry.setCursorPosition(0)

	self.rangeHiLabel = QtGui.QLabel(" To: ")
	self.rangeHiEntry = QtGui.QLineEdit("1.0")
	self.rangeHiEntry.setCursorPosition(0)

	self.numSampsLabel = QtGui.QLabel("#Points = ")
	self.numSampsEntry = QtGui.QLineEdit("200")
        leftBox = QtGui.QGridLayout()
        leftBox.setHorizontalSpacing(10)
        leftBox.addWidget(self.funcLabel, 0, 0,1 ,1)
        leftBox.addWidget(self.funcEntry, 0, 1, 1, 3)
        leftBox.addWidget(self.rangeLoLabel, 1, 0,1,1)
        leftBox.addWidget(self.rangeLoEntry, 1, 1,1,1)
        leftBox.addWidget(self.rangeHiLabel, 1, 2,1,1)
        leftBox.addWidget(self.rangeHiEntry, 1, 3,1,1)
        leftBox.addWidget(self.numSampsLabel, 2, 0,1,1)
        leftBox.addWidget(self.numSampsEntry, 2, 1,1,1)
        leftBox.addWidget(self.goButton, 3, 0,1,1)
Something it's important to be aware of, is that in order to evaluate an arbitrary string that is typed into self.funcEntry as interpretable code (so that the corresponding Y-value can be calculated), we will need to make use of the eval() method. And so what happens if the user submits something unintelligible like n9a34ga934a3490g03, or even something malicious like os.system("rm -r /") from self.funcEntry ?
Clearly, we are going to need some sort of parsing and validation routine to determine the space of possible actions that a "Display!" click can trigger. We can do this by implementing a sort of "bouncer" method, which decides whether a given string is or is not acceptable for evaluation. A fundamental idealogical decision will be whether to default to "friendly", and check for a list of illegal characteristics, or to default to "unfriendly", and only accept inputs meeting some combination of legality criteria. You will have much more freedom with the former approach, and also be much less protected from transcribing any creative viral code injection. On the other hand, a malicious user can't do anything from an eval-exposed GUI that they couldn't do from the command line at the same computer, except maybe crash the GUI in creative fashion, so as long as you're not trying to run this as a web app (for which you would use Javascript, not PyQt), or maybe from a public terminal in a library or something, it's probably not worth your time to obsess over an extremely rigorous/paranoid validation scheme.
That being said, we are not trying to write a systems utility here, we are trying to write a graphing calculator. And so we probably don't want to allow commands making use of libraries which we haven't approved (eg, "math" or "numpy"). We should probably also make various keywords illegal, like for example [break, class, def, del, eval, exec, global, import, open]. And we may want to disallow assignment operators, since we will be using an eval() statement, not an exec(); though we may like to enable comparisons such as '>=' or '=='. Again, how intense you want to be about this really just depends on your disposition, and your projected end-use for your script. In this example, we'll stick with the basics: disallowing unapproved library requests, unapproved assignment operators, and certain reserved keywords.
"""Does the longString start with the subString?"""
def startsWith(longString, subString):
    compLength = len(subString)
    if compLength > len(longString):
        return False
    if longString[:compLength] == subString:
        return True
    else:
        return False
"""Does the longString end with the subString?"""
def endsWith(longString, subString):
    compLength = len(subString)
    if compLength > len(longString):
        return False
    if longString[-1*compLength:] == subString:
        return True
    else:
        return False

def makeGraph(self):
    #begin validation
    ValidEval = True
    errorFound = ""
    okLibs=["math", "np"]
    okParams=['key'] # maybe the user will want to use a sort() in their function, which may require a specified key to a lambda fn
    badWords=[" break", " class", " def", " del", " eval", " exec", " global", " import", " open"]
    rawStatement=str(self.funcEntry.text()).strip()

    if len(rawStatement) == 0:
        ValidEval = False
        errorFound="no Entry"
    for epos, echar in enumerate(rawStatement):
	#bad library check
        if echar=='.' and epos > 0:
            checkchar=rawStatement[epos-1]
            if checkchar.isalpha():
                libVerified = False
                checkThis = rawStatement[:epos].split(' ')[-1]
                for eLib in okLibs:
                    checkLib = endsWith(checkThis, eLib)
                    if checkLib:
                        libVerified = True

                if not libVerified:
                    ValidEval = False
                    errorFound="Illegal Library request: "+ checkThis
	#bad assignment check
        if echar=='=':
            if (epos == 0 or (epos==len(rawStatement)-1)):
                ValidEval = False
                errorFound = "Bad Syntax, can't use peripheral '='"
            else:
                checkchar = rawStatement[epos-1]
                if not (  (checkchar=='>') or (checkchar=='<') or (checkchar=='!') or (checkchar=='=') or rawStatement[epos+1]=='='):
                    checkThis = rawStatement[:epos].strip(' ')
                    paramVerified = False
                    for eParam in okParams:
                        checkParam = endsWith(checkThis, eParam)
                        if checkParam:
                            paramVerified = True
                    if not paramVerified:
                        ValidEval = False
                        errorFound = "Illegal assignment operator"
	#bad keyword check
    for badWord in badWords:
        if badWord in rawStatement or startsWith(rawStatement, badWord[1:]):
            ValidEval = False
            errorFound = "Illegal phrase used: " + badWord + " --watch yourself!"
ValidEval boolean, and an errorFound empty string, which has the advantage of being equivalent to a boolean False, but also being amenable to len() calls, with the capacity to store arbitrarily informative error messages.
Another (slightly unorthodox) step we can take to empower our user is to assign global scope to our iterated variable (x in this case). This should not represent any sort of security flaw, since any value that x could ever take must first be validated as a legitimate numeric type. The only caveat that accompanies this decision, is that we must remember that x is now global, and avoid using this variable in any other context while a calculation loop is running. The hidden benefit of this approach is that it enables Numpy to iterate over functions of arrays that incorporate x, empowering the user to calculate sums and products over sequences of terms dependent on x, or even determine scalars associated with algorithmically enumerable matrices and tensors. And so, without further ado, the code for our basic example (which can also be obtained from GitHub, in the graphingCalculator tree):
from PyQt4 import QtCore, QtGui, Qt
import sys
from matplotlib.figure import Figure
from matplotlib.backends.backend_qt4agg import FigureCanvasQTAgg as FigureCanvas
from matplotlib.backends.backend_qt4agg import NavigationToolbar2QTAgg as NavigationToolbar
from matplotlib.backend_bases import key_press_handler
import math
import numpy as np


def startsWith(longString, subString):
    compLength = len(subString)
    if compLength > len(longString):
        return False
    if longString[:compLength] == subString:
        return True
    else:
        return False

def endsWith(longString, subString):
    compLength = len(subString)
    if compLength > len(longString):
        return False
    if longString[-1*compLength:] == subString:
        return True
    else:
        return False


class ApplicationWindow(QtGui.QMainWindow):
    def __init__(self):
        QtGui.QMainWindow.__init__(self)
        self.initUI()
    def initUI(self):
        self.main_frame = QtGui.QWidget()
        self.setWindowTitle("Basic mpl/PyQt Graphing Calculator")

# Entry widgets and logic
        self.funcLabel = QtGui.QLabel("y(x) = ")
        self.funcEntry = QtGui.QLineEdit("Type your function here")
        self.funcEntry.setCursorPosition(0)

        self.rangeLoLabel = QtGui.QLabel("From: ")
        self.rangeLoEntry = QtGui.QLineEdit("0.0")
        self.rangeLoEntry.setCursorPosition(0)

        self.rangeHiLabel = QtGui.QLabel(" To: ")
        self.rangeHiEntry = QtGui.QLineEdit("1.0")
        self.rangeHiEntry.setCursorPosition(0)

        self.numSampsLabel = QtGui.QLabel("#Points = ")
        self.numSampsEntry = QtGui.QLineEdit("200")

        self.goButton = QtGui.QPushButton("Display!")
        self.goButton.clicked.connect(self.makeGraph)

#Output-display widgets and logic
        self.fig=Figure()
        self.axes = self.fig.add_subplot(111)
        self.x = np.arange(0.0, 1.0, 0.01)
        self.y = np.cos(2*np.pi*self.x + 5) + 2
        self.axes.plot(self.x, self.y)
        self.canvas=FigureCanvas(self.fig)
        self.canvas.setParent(self.main_frame)
        self.canvas.setFocusPolicy(QtCore.Qt.StrongFocus)
        self.canvas.setFocus()
        self.ntb = NavigationToolbar(self.canvas, self.main_frame)
        self.canvas.mpl_connect('key_press_event', self.on_key_press)


#Layout logic

        leftBox = QtGui.QGridLayout()
        leftBox.setHorizontalSpacing(10)
        leftBox.addWidget(self.funcLabel, 0, 0,1 ,1)
        leftBox.addWidget(self.funcEntry, 0, 1, 1, 3)
        leftBox.addWidget(self.rangeLoLabel, 1, 0,1,1)
        leftBox.addWidget(self.rangeLoEntry, 1, 1,1,1)
        leftBox.addWidget(self.rangeHiLabel, 1, 2,1,1)
        leftBox.addWidget(self.rangeHiEntry, 1, 3,1,1)
        leftBox.addWidget(self.numSampsLabel, 2, 0,1,1)
        leftBox.addWidget(self.numSampsEntry, 2, 1,1,1)
        leftBox.addWidget(self.goButton, 3, 0,1,1)

        self.dumbWidget = QtGui.QWidget()
        self.dumbWidget.setFixedWidth(300)
        self.dumbWidget.setLayout(leftBox)

        rightBox = QtGui.QVBoxLayout()
        rightBox.addWidget(self.canvas)  # the matplotlib canvas
        rightBox.addWidget(self.ntb)

        leftRight = QtGui.QHBoxLayout()
        leftRight.addWidget(self.dumbWidget)
        leftRight.addLayout(rightBox)
        self.main_frame.setLayout(leftRight)
        self.setCentralWidget(self.main_frame)

    def on_key_press(self, event):
        print('you pressed', event.key)
        key_press_handler(event, self.canvas, self.ntb)


    """
    Overview of the method: responds to clicks of the 'Display!' button
    1) validates the string in self.funcEntry
    2) validates the Lo, Hi, and Samps Entries
    3) attempts to eval the string within a for-loop over the range defined by domain specs

    """
    def makeGraph(self):
        #begin validation
        ValidEval = True
        errorFound = ""
        okLibs=["math"]
        okParams=['key']
        badWords=[" break", " class", " def", " del", " eval", " exec", " global", " import", " open"]
        rawStatement=str(self.funcEntry.text()).strip()

        if len(rawStatement) == 0:
            ValidEval = False
            errorFound="no Entry"
        for epos, echar in enumerate(rawStatement):
            if echar=='.' and epos > 0:
                checkchar=rawStatement[epos-1]
                if checkchar.isalpha():
                    libVerified = False
                    checkThis = rawStatement[:epos].split(' ')[-1]
                    for eLib in okLibs:
                        checkLib = endsWith(checkThis, eLib)
                        if checkLib:
                            libVerified = True

                    if not libVerified:
                        ValidEval = False
                        errorFound="Illegal Library request: "+ checkThis

            if echar=='=':
                if (epos == 0 or (epos==len(rawStatement)-1)):
                    ValidEval = False
                    errorFound = "Bad Syntax, can't use peripheral '='"
                else:
                    checkchar = rawStatement[epos-1]
                    if not (  (checkchar=='>') or (checkchar=='<') or (checkchar=='!') or (checkchar=='=') or rawStatement[epos+1]=='='):
                        checkThis = rawStatement[:epos].strip(' ')
                        paramVerified = False
                        for eParam in okParams:
                            checkParam = endsWith(checkThis, eParam)
                            if checkParam:
                                paramVerified = True
                        if not paramVerified:
                            ValidEval = False
                            errorFound = "Illegal assignment operator"
        for badWord in badWords:
            if badWord in rawStatement or startsWith(rawStatement, badWord[1:]):
                ValidEval = False
                errorFound = "Illegal phrase used: " + badWord + " --watch yourself!"

        numType = 'int'
        #OK now we can try to scrape the parameters...
        if ValidEval:
            boundKeys = ["rangeLo", "rangeHi", "numSamples"]
            boundWidgets=[self.rangeLoEntry, self.rangeHiEntry, self.numSampsEntry]
            self.boundDict = {}
            for epos, ewidget in enumerate(boundWidgets):
                rawVal = str(ewidget.text()).strip()
                try:
                    rawInt = int(rawVal)
                    self.boundDict[boundKeys[epos]] = rawInt
                except:
                    try:
                        rawFloat = float(rawVal)
                        self.boundDict[boundKeys[epos]] = rawFloat
                        numType = 'float'
                    except:
                        ValidEval = False
                        errorFound = "illegal non-numeric parameter: " + rawVal
        if ValidEval and not errorFound:
            print "ValidEval for entry:"
            print rawStatement
            print "boundDict: "
            print self.boundDict
            try:
                self.x = np.linspace(self.boundDict['rangeLo'], self.boundDict['rangeHi'], self.boundDict['numSamples'])
                self.y = np.zeros((self.boundDict['numSamples'],))
                goodEvals = 0
                print 'initial config ok'
		global x
                for ePos, eVal in enumerate(self.x):
                    try:
                        x=eVal
                        self.y[ePos]=eval(rawStatement)
                        goodEvals += 1
                    except:
                        self.y[ePos] = np.nan
                        #Function has to evaluate correctly for the lower bound,
                        #in order to guard against wasting massive cycles on a syntax error
                        if ePos == 0:
                            print "first eval fails. breaking loop"
                            break

                if goodEvals >= 1:
                    print("good Evaluation: "+ str(goodEvals) )
                    self.axes.cla()
                    self.axes.plot(self.x, self.y)
                    self.canvas.draw()
                else:
                    errorFound = "unconclusive eval statement. check your syntax"
            except:
                errorFound = "execution error"
                print errorFound
        else:
            print "entry Error:"
            print errorFound
        if errorFound:
            print "generating QMessageBox"
            errorString ='"Cause every little thing; is gonna be alright"... someday. But not today, sorry. \nPlease try a better function.\n Immune response rejection status(es):\n' + errorFound
            ermg = QtGui.QMessageBox(QtGui.QMessageBox.NoIcon, 'No bueno!', errorString)
            ermg.exec_()


def main():

    qApp = QtGui.QApplication(sys.argv)
    a=ApplicationWindow()
    a.show()
    sys.exit(qApp.exec_())
if __name__ == '__main__':
    main()
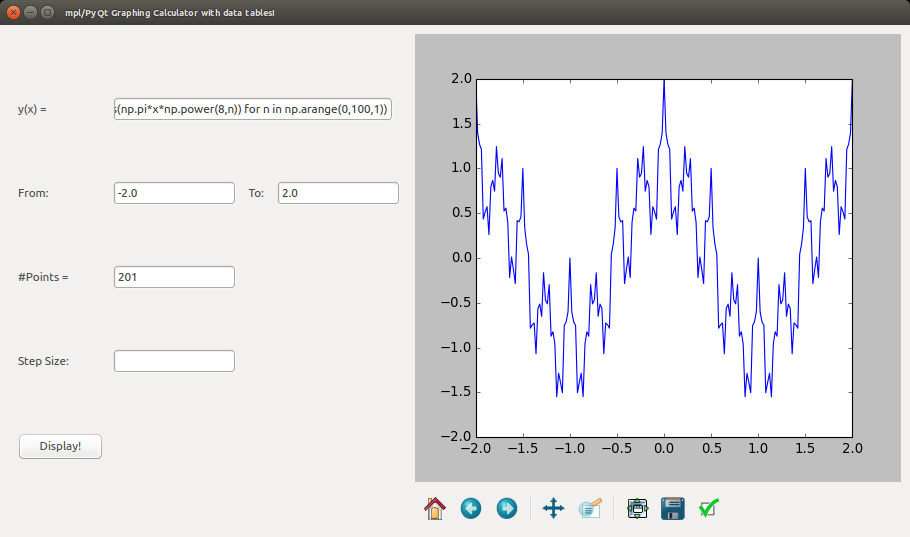
self.boundDict container for boundary condition inputs to make our program "smarter", by adding an entry field for fixed sample spacing, and then autodetecting whether sufficient information has been provided to form a Numpy array. Any three of (self.rangeLoEntry, self.rangeHiEntry, self.numSampsEntry, self.sampSpaceEntry) will suffice to define an x-axis array, but we like to keep the rangeLoEntry fixed so that we can test validated eval() requests for (legal) bad syntax, without wasting cycles as we iterate over the x-axis. And so with the following slight modifications, we can allow our user to specify boundary conditions using any two of the three other parameters that they like!
.
.
.
        self.sampSpaceLabel = QtGui.QLabel("Step Size: ")
        self.sampSpaceEntry = QtGui.QLineEdit("")
.
.
.
        leftBox.addWidget(self.sampSpaceLabel, 3, 0,1,1)
        leftBox.addWidget(self.sampSpaceEntry, 3, 1,1,1)
        leftBox.addWidget(self.goButton, 4, 0,1,1)
.
.
.

        #OK now we can try to scrape the parameters...
        numType = 'int'
        if ValidEval:
            boundKeys = ["rangeLo", "rangeHi", "numSamples", "sampleSpacing"]
            boundWidgets=[self.rangeLoEntry, self.rangeHiEntry, self.numSampsEntry, self.sampSpaceEntry]
            self.boundDict = {}

            numStrikes = 0
            maxStrikes = 2
            numVerified = 0
            maxVerified = 3
            for epos, ewidget in enumerate(boundWidgets):
                rawVal = str(ewidget.text()).strip()
                try:
                    rawInt = int(rawVal)
                    self.boundDict[boundKeys[epos]] = rawInt
                    numVerified += 1
                except:
                    try:
                        rawFloat = float(rawVal)
                        self.boundDict[boundKeys[epos]] = rawFloat
                        numVerified += 1
                        numType = 'float'
                    except:
                        numStrikes += 1
                        if epos == 0 or numStrikes >= maxStrikes:
                            ValidEval = False
                            errorFound = "Too Many illegal boundary conditions"
                if numVerified >= maxVerified:
                    break

        if ValidEval and not errorFound:
            print "ValidEval for entry:"
            print rawStatement
            print "boundDict: "
            print self.boundDict
            try:

                if "sampleSpacing" in self.boundDict.keys():
                    if "rangeHi" in self.boundDict.keys():
                        self.x = np.arange(self.boundDict['rangeLo'], self.boundDict['rangeHi'], self.boundDict['sampleSpacing'], dtype = numType)
                    elif "numSamples" in self.boundDict.keys():
                        self.x = np.full((self.boundDict['numSamples'],), self.boundDict['rangeLo'], dtype = numType)

                        stepSize = self.boundDict['sampleSpacing']
                        for i in range(1,self.x.size):
                            self.x[i] = self.x[i-1] + stepSize
                    else:
                        raise LookupError

                elif "rangeHi" in self.boundDict.keys() and "numSamples" in self.boundDict.keys():
                    self.x = np.linspace(self.boundDict['rangeLo'], self.boundDict['rangeHi'], self.boundDict['numSamples'])
                else:
                    raise LookupError
.
.
.
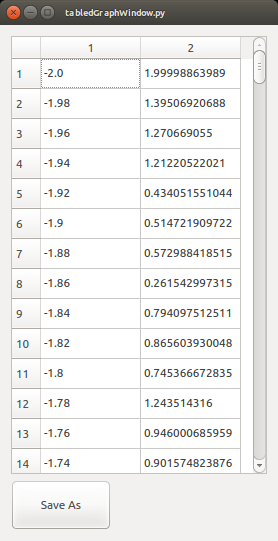
Last but not least, we would like to be able to generate a table and/or delimited text file containing the raw data corresponding to the mpl plot in our application. This will be invaluable if we need to examine individual data points, or wish to analyze the data at some point in the future. There are two distinct approaches by which we can generate display tables: either we can utilize a tabbed monolithic system, or each table can take the form of an undocked, distinct widget output. While the first option is very useful for certain tasks (and I intend to cover a sample implementation of the scheme in a future tutorial), the second is much more convenient in the situation where we would like to be able to generate lots of data, but don't need the graphical display to persist over the course of multiple "GO!" commands. So we will do our tables "Free Bird"-style for this example. Our strategy consists of defining a new subclass of QWidget, which compounds a QTableWidget and a QPushButton into a single vertical layout, and accepts a Numpy array as an initialization argument. We then need only to stack and transpose our calculated self.x and self.y vectors (since they are stored as a single row, but we would like to display them as columns), and add an instantiation call for our freeTableWidget to every successfully completed makeGraph() call:
.
.
.
		if goodEvals >= 1:
                    print("good Evaluation: "+ str(goodEvals) )
                    self.axes.cla()
                    self.axes.plot(self.x, self.y)
                    self.canvas.draw()

                    print "creating newFreeTable"
                    NPdata = np.vstack((self.x,self.y))
                    NPdata=np.transpose(NPdata)
                    print "data reformatted"
                    newFreeTable = freeTableWidget(NPdata, self)
                    self.liveTables.append(newFreeTable)
                    newFreeTable.show()
.
.
.
class freeTableWidget(QtGui.QWidget):
    def __init__(self, NPdata, parent=None):
        QtGui.QWidget.__init__(self)
        self.initUI(NPdata, parent)

    def initUI(self, NPdata, parent):
        print "freeTableWidget initialized"
        if parent is not None:
            self.parent = parent

        self.NPdata = NPdata
        self.tableSize = self.NPdata.shape

        self.mainTable=QtGui.QTableWidget()
        self.mainTable.setRowCount(self.tableSize[0])
        self.mainTable.setColumnCount(self.tableSize[1])
        print "preparing to fill table"
        for i in range(self.tableSize[1]):
            for j in range(self.tableSize[0]):
                thisVal = self.NPdata[j][i]
                qtwi = QtGui.QTableWidgetItem(str(thisVal))
                self.mainTable.setItem(j, i, qtwi)
        print "table filled"
        self.saveButton = QtGui.QPushButton('Save As')
        self.saveButton.setFixedSize(100,50)
        self.saveButton.clicked.connect(self.saveTable)

        vbox = QtGui.QVBoxLayout()
        vbox.addWidget(self.mainTable)
        vbox.addWidget(self.saveButton)
        self.setLayout(vbox)
The mpl navigation window automatically comes with an icon for saving any graph view as an image file (convenient, right?!), but we would also like to be able to save the raw data we have generated as a delimited text file, so that we can load it into any other application that we have written or downloaded. Luckily, Python/PyQt makes this super straightforward to do.
    def saveTable(self):
        saveFile=QtGui.QFileDialog.getSaveFileName()
        f=open(saveFile, 'a')
        for erow in range(self.tableSize[0]):
            outstring = str(self.NPdata[erow][0]) + ';'
            for ecol in range(1, self.tableSize[1]):
                outstring += str(self.NPdata[erow][ecol])
                outstring += ';'
            outstring += '\n'
            f.write(outstring)
        f.close()
from PyQt4 import QtCore, QtGui, Qt
import sys
from matplotlib.figure import Figure
from matplotlib.backends.backend_qt4agg import FigureCanvasQTAgg as FigureCanvas
from matplotlib.backends.backend_qt4agg import NavigationToolbar2QTAgg as NavigationToolbar
from matplotlib.backend_bases import key_press_handler
import math
import numpy as np


def startsWith(longString, subString):
    compLength = len(subString)
    if compLength > len(longString):
        return False
    if longString[:compLength] == subString:
        return True
    else:
        return False

def endsWith(longString, subString):
    compLength = len(subString)
    if compLength > len(longString):
        return False
    if longString[-1*compLength:] == subString:
        return True
    else:
        return False


class ApplicationWindow(QtGui.QMainWindow):
    def __init__(self):
        QtGui.QMainWindow.__init__(self)
        self.initUI()
    def initUI(self):
        self.main_frame = QtGui.QWidget()
        self.setWindowTitle("mpl/PyQt Graphing Calculator with data tables!")

# Entry widgets and logic
        self.funcLabel = QtGui.QLabel("y(x) = ")
        self.funcEntry = QtGui.QLineEdit("Type your function here")
        self.funcEntry.setFixedWidth(280)
        self.funcEntry.setCursorPosition(0)

        self.rangeLoLabel = QtGui.QLabel("From: ")
        self.rangeLoEntry = QtGui.QLineEdit("0.0")
        self.rangeLoEntry.setCursorPosition(0)

        self.rangeHiLabel = QtGui.QLabel(" To: ")
        self.rangeHiEntry = QtGui.QLineEdit("1.0")
        self.rangeHiEntry.setCursorPosition(0)

        self.numSampsLabel = QtGui.QLabel("#Points = ")
        self.numSampsEntry = QtGui.QLineEdit("200")

        self.sampSpaceLabel = QtGui.QLabel("Step Size: ")
        self.sampSpaceEntry = QtGui.QLineEdit("")

        self.goButton = QtGui.QPushButton("Display!")
        self.goButton.clicked.connect(self.makeGraph)

#Output-display widgets and logic
        self.fig=Figure()
        self.axes = self.fig.add_subplot(111)
        self.x = np.arange(0.0, 1.0, 0.01)
        self.y = np.cos(2*np.pi*self.x + 5) + 2
        self.axes.plot(self.x, self.y)
        self.canvas=FigureCanvas(self.fig)
        self.canvas.setParent(self.main_frame)
        self.canvas.setFocusPolicy(QtCore.Qt.StrongFocus)
        self.canvas.setFocus()
        self.ntb = NavigationToolbar(self.canvas, self.main_frame)
        self.canvas.mpl_connect('key_press_event', self.on_key_press)


#Layout logic

        leftBox = QtGui.QGridLayout()
        leftBox.setHorizontalSpacing(10)
        #self.pushLabel = QtGui.QSpacerItem(200,200)
        leftBox.addWidget(self.funcLabel, 0, 0,1 ,1)
        leftBox.addWidget(self.funcEntry, 0, 1, 1, 3)
        #leftBox.addItem(self.pushLabel, 0,4,3,4)
        leftBox.addWidget(self.rangeLoLabel, 1, 0,1,1)
        leftBox.addWidget(self.rangeLoEntry, 1, 1,1,1)
        leftBox.addWidget(self.rangeHiLabel, 1, 2,1,1)
        leftBox.addWidget(self.rangeHiEntry, 1, 3,1,1)
        leftBox.addWidget(self.numSampsLabel, 2, 0,1,1)
        leftBox.addWidget(self.numSampsEntry, 2, 1,1,1)
        leftBox.addWidget(self.sampSpaceLabel, 3, 0,1,1)
        leftBox.addWidget(self.sampSpaceEntry, 3, 1,1,1)
        leftBox.addWidget(self.goButton, 4, 0,1,1)

        self.dumbWidget = QtGui.QWidget()
        self.dumbWidget.setFixedWidth(400)
        self.dumbWidget.setLayout(leftBox)

        rightBox = QtGui.QVBoxLayout()
        rightBox.addWidget(self.canvas)  # the matplotlib canvas
        rightBox.addWidget(self.ntb)

        leftRight = QtGui.QHBoxLayout()
        leftRight.addWidget(self.dumbWidget)
        leftRight.addLayout(rightBox)
        self.main_frame.setLayout(leftRight)
        self.setCentralWidget(self.main_frame)

        self.liveTables = []

    def on_key_press(self, event):
        print('you pressed', event.key)
        key_press_handler(event, self.canvas, self.ntb)


    """
    Overview of the method: responds to clicks of the 'Display!' button
    1) validates the string in self.funcEntry
    2) validates the Lo, Hi, and Samps Entries
    3) attempts to eval the string within a for-loop over the range defined by domain specs

    """
    def makeGraph(self):
#begin validation
        ValidEval = True
        errorFound = ""
        okLibs=["math", "np"]
        okParams=['key']
        badWords=[" break", " class", " def", " del", " eval", " exec", " global", " import", " open"]
        rawStatement=str(self.funcEntry.text()).strip()

        if len(rawStatement) == 0:
            ValidEval = False
            errorFound="no Entry"
        for epos, echar in enumerate(rawStatement):
            if echar=='.' and epos > 0:
                checkchar=rawStatement[epos-1]
                if checkchar.isalpha():
                    libVerified = False
                    checkThis = rawStatement[:epos].split(' ')[-1]
                    for eLib in okLibs:
                        checkLib = endsWith(checkThis, eLib)
                        if checkLib:
                            libVerified = True

                    if not libVerified:
                        ValidEval = False
                        errorFound="Illegal Library request: "+ checkThis

            if echar=='=':
                if (epos == 0 or (epos==len(rawStatement)-1)):
                    ValidEval = False
                    errorFound = "Bad Syntax, can't use peripheral '='"
                else:
                    checkchar = rawStatement[epos-1]
                    if not (  (checkchar=='>') or (checkchar=='<') or (checkchar=='!') or (checkchar=='=') or rawStatement[epos+1]=='='):
                        checkThis = rawStatement[:epos].strip(' ')
                        paramVerified = False
                        for eParam in okParams:
                            checkParam = endsWith(checkThis, eParam)
                            if checkParam:
                                paramVerified = True
                        if not paramVerified:
                            ValidEval = False
                            errorFound = "Illegal assignment operator"
        for badWord in badWords:
            if badWord in rawStatement or startsWith(rawStatement, badWord[1:]):
                ValidEval = False
                errorFound = "Illegal phrase used: " + badWord + " --watch yourself!"


        #OK now we can try to scrape the parameters...
        numType = 'int'
        if ValidEval:
            boundKeys = ["rangeLo", "rangeHi", "numSamples", "sampleSpacing"]
            boundWidgets=[self.rangeLoEntry, self.rangeHiEntry, self.numSampsEntry, self.sampSpaceEntry]
            self.boundDict = {}

            numStrikes = 0
            maxStrikes = 2
            numVerified = 0
            maxVerified = 3
            for epos, ewidget in enumerate(boundWidgets):
                rawVal = str(ewidget.text()).strip()
                try:
                    rawInt = int(rawVal)
                    self.boundDict[boundKeys[epos]] = rawInt
                    numVerified += 1
                except:
                    try:
                        rawFloat = float(rawVal)
                        self.boundDict[boundKeys[epos]] = rawFloat
                        numVerified += 1
                        numType = 'float'
                    except:
                        numStrikes += 1
                        if epos == 0 or numStrikes >= maxStrikes:
                            ValidEval = False
                            errorFound = "Too Many illegal boundary conditions"
                if numVerified >= maxVerified:
                    break

        if ValidEval and not errorFound:
            print "ValidEval for entry:"
            print rawStatement
            print "boundDict: "
            print self.boundDict
            try:

                if "sampleSpacing" in self.boundDict.keys():
                    if "rangeHi" in self.boundDict.keys():
                        self.x = np.arange(self.boundDict['rangeLo'], self.boundDict['rangeHi'], self.boundDict['sampleSpacing'], dtype = numType)
                    elif "numSamples" in self.boundDict.keys():
                        self.x = np.full((self.boundDict['numSamples'],), self.boundDict['rangeLo'], dtype = numType)

                        stepSize = self.boundDict['sampleSpacing']
                        for i in range(1,self.x.size):
                            self.x[i] = self.x[i-1] + stepSize
                    else:
                        raise LookupError

                elif "rangeHi" in self.boundDict.keys() and "numSamples" in self.boundDict.keys():
                    self.x = np.linspace(self.boundDict['rangeLo'], self.boundDict['rangeHi'], self.boundDict['numSamples'])
                else:
                    raise LookupError

                self.y = np.zeros((self.x.size,))
                goodEvals = 0
                print 'initial config ok'
		global x
                for ePos, eVal in enumerate(self.x):
                    try:
                        x=eVal
                        self.y[ePos]=eval(rawStatement)
                        goodEvals += 1
                    except:
                        self.y[ePos] = np.nan
                        #Function has to evaluate correctly for the lower bound,
                        #in order to guard against wasting massive cycles on a syntax error
                        if ePos == 0:
                            print "first eval fails. breaking loop"
                            break

                if goodEvals >= 1:
                    print("good Evaluation: "+ str(goodEvals) )
                    self.axes.cla()
                    self.axes.plot(self.x, self.y)
                    self.canvas.draw()

                    print "creating newFreeTable"
                    NPdata = np.vstack((self.x,self.y))
                    NPdata=np.transpose(NPdata)
                    print "data reformatted"
                    newFreeTable = freeTableWidget(NPdata, self)
                    self.liveTables.append(newFreeTable)
                    newFreeTable.show()

                else:
                    errorFound = "unconclusive eval statement. check your syntax"
            except:
                errorFound = "execution error"
                print errorFound
        else:
            print "entry Error:"
            print errorFound
        if errorFound:
            print "generating QMessageBox"
            errorString ='"Cause every little thing; is gonna be alright"... someday. But not today, sorry. \nPlease try a better function.\n Immune response rejection status(es):\n' + errorFound
            ermg = QtGui.QMessageBox(QtGui.QMessageBox.NoIcon, 'No bueno!', errorString)
            ermg.exec_()


class freeTableWidget(QtGui.QWidget):
    def __init__(self, NPdata, parent=None):
        QtGui.QWidget.__init__(self)
        self.initUI(NPdata, parent)

    def initUI(self, NPdata, parent):
        print "freeTableWidget initialized"
        if parent is not None:
            self.parent = parent

        self.NPdata = NPdata
        self.tableSize = self.NPdata.shape

        self.mainTable=QtGui.QTableWidget()
        self.mainTable.setRowCount(self.tableSize[0])
        self.mainTable.setColumnCount(self.tableSize[1])
        print "preparing to fill table"
        for i in range(self.tableSize[1]):
            for j in range(self.tableSize[0]):
                thisVal = self.NPdata[j][i]
                qtwi = QtGui.QTableWidgetItem(str(thisVal))
                self.mainTable.setItem(j, i, qtwi)
        print "table filled"
        self.saveButton = QtGui.QPushButton('Save As')
        self.saveButton.setFixedSize(100,50)
        self.saveButton.clicked.connect(self.saveTable)

        vbox = QtGui.QVBoxLayout()
        vbox.addWidget(self.mainTable)
        vbox.addWidget(self.saveButton)
        self.setLayout(vbox)

    def saveTable(self):
        saveFile=QtGui.QFileDialog.getSaveFileName()
        f=open(saveFile, 'a')
        for erow in range(self.tableSize[0]):
            outstring = str(self.NPdata[erow][0]) + ';'
            for ecol in range(1, self.tableSize[1]):
                outstring += str(self.NPdata[erow][ecol])
                outstring += ';'
            outstring += '\n'
            f.write(outstring)
        f.close()


def main():

    qApp = QtGui.QApplication(sys.argv)
    a=ApplicationWindow()
    a.show()
    sys.exit(qApp.exec_())
if __name__ == '__main__':
    main()
As demonstrated below, we can use this application to obtain a graphic representation of the first hundred terms of a Weierstrass function (an infamous little monkey wrench in the history of real analysis and number theory closely related to the Fourier series, which also indirectly contributed to the evolution of transfinite set theory and fractal chaos due to its remarkable property of being everywhere continuous yet nowhere differentiable). To call up such a beast for ourselves, we need merely recite the following one-liner to self.funcEntry:
np.sum(np.power(0.5,n)*np.cos(np.pi*x*np.power(8,n)) for n in np.arange(0,100,1))
So now that we have our basic functionality firing on all cylinders (ie, we can display a line plot of any single-parameter, single-line function using the math and Numpy libraries that we are sufficiently creative to concoct), we are free to make whatever mods and extensions we like!
In my case, I used this skeleton as a template for a data-streaming app with a real-time graphic display, which provided a great opportunity to learn firsthand just where the throughput performance limits of matplotlib actually lie... I'll probably post a tutorial for it whenever I get around to writing the documentation for my PyDuino module.
You're of course more than welcome to fork either template from Github ...
Best of Luck, and Happy Hacking!